> ## Documentation Index
> Fetch the complete documentation index at: https://checkly-422f444a-mda-troubleshooting-section.mintlify.site/llms.txt
> Use this file to discover all available pages before exploring further.
# TCP Monitor Configuration
> Configure your TCP monitor to ensure your network services are always available.
TCP monitors verify the availability of non-HTTP services by establishing a connection to a specific host and port.
To configure a TCP monitor using code, learn more about the [TCP Monitor Construct](/constructs/tcp-monitor).
### Basic Setup
Configure your TCP monitor by specifying the target service:
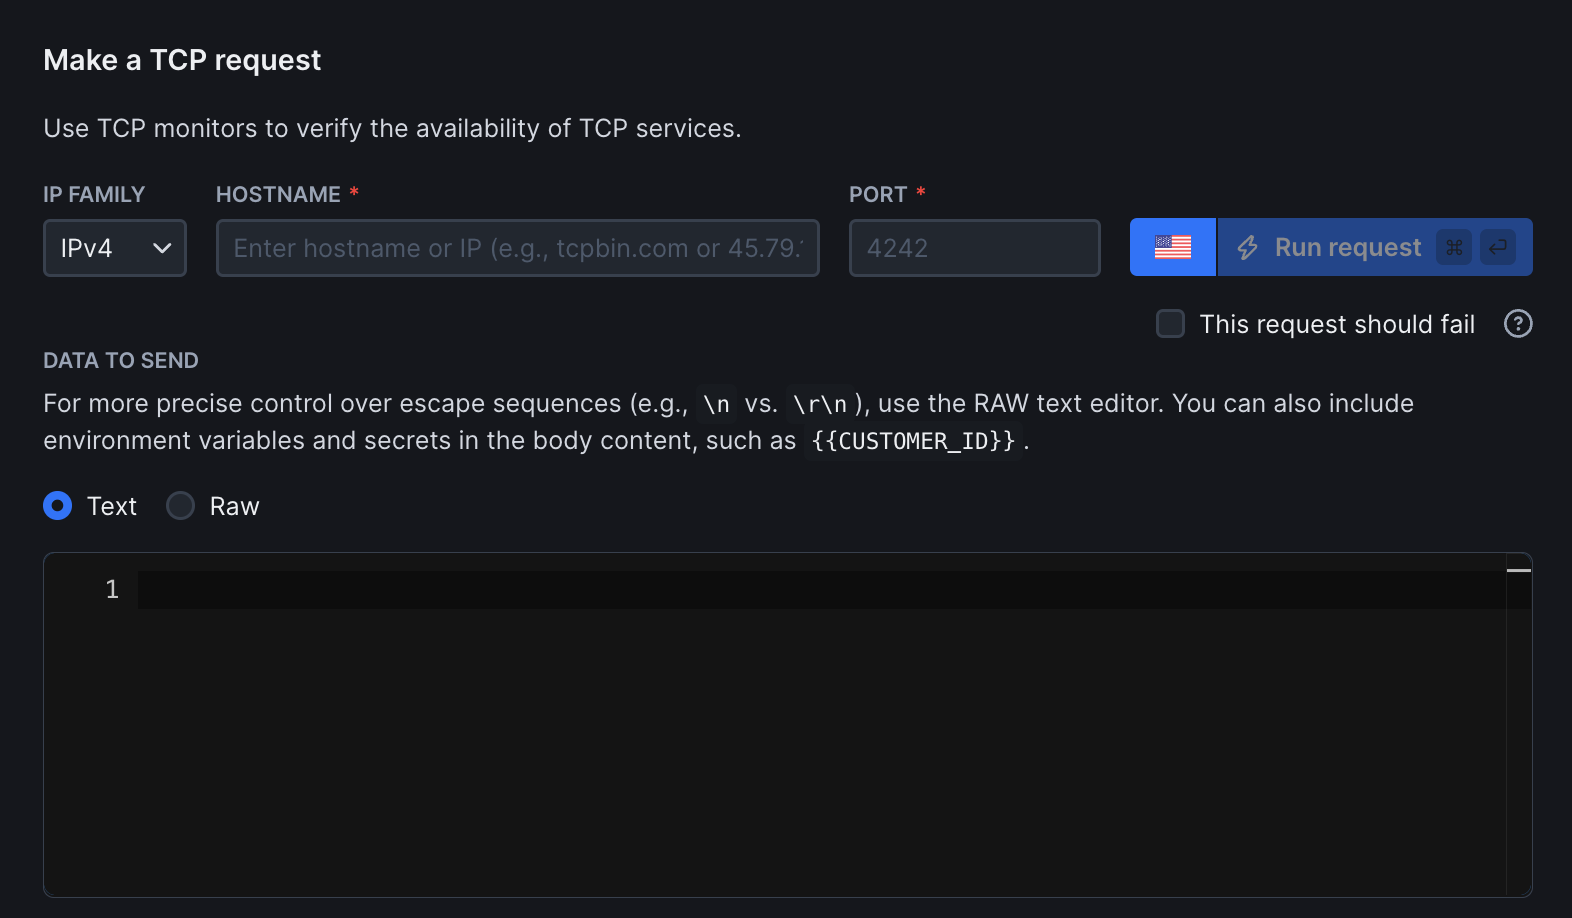 * **Hostname:** The server you want to monitor (e.g. `db.example.com`)
* **Port:** The TCP port your service is listening on (e.g. `3306` for MySQL)
* **IP family:** Defaults to IPv4
### Assertions
Configure connection timeouts and data transmission assertions:
* **Hostname:** The server you want to monitor (e.g. `db.example.com`)
* **Port:** The TCP port your service is listening on (e.g. `3306` for MySQL)
* **IP family:** Defaults to IPv4
### Assertions
Configure connection timeouts and data transmission assertions:
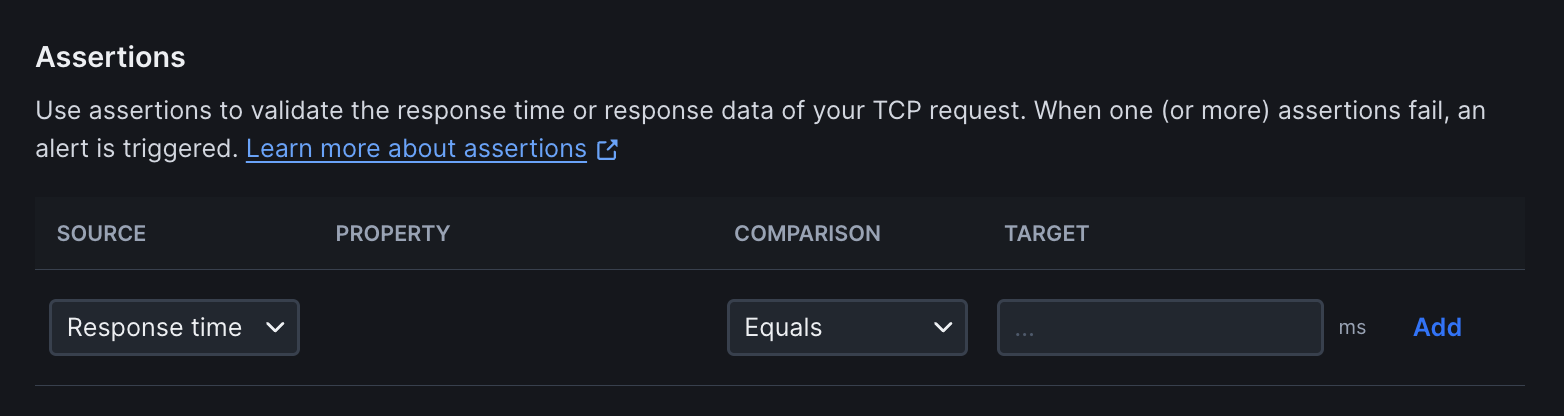 * **Connection timeout:** Maximum time to wait for connection (default: 10 seconds)
* **Read timeout:** Time to wait for response after connection (default: 10 seconds)
* **Data to send:** Optional data to transmit after establishing connection
For more details, see our documentation on [Assertions](/detect/assertions).
### Response Validation
Validate the service response for more precise monitoring:
* **Connection timeout:** Maximum time to wait for connection (default: 10 seconds)
* **Read timeout:** Time to wait for response after connection (default: 10 seconds)
* **Data to send:** Optional data to transmit after establishing connection
For more details, see our documentation on [Assertions](/detect/assertions).
### Response Validation
Validate the service response for more precise monitoring:
 * **Response data:** Expected text pattern in the response
* **Response time limits:** Define performance thresholds for degraded or failed states
### Frequency
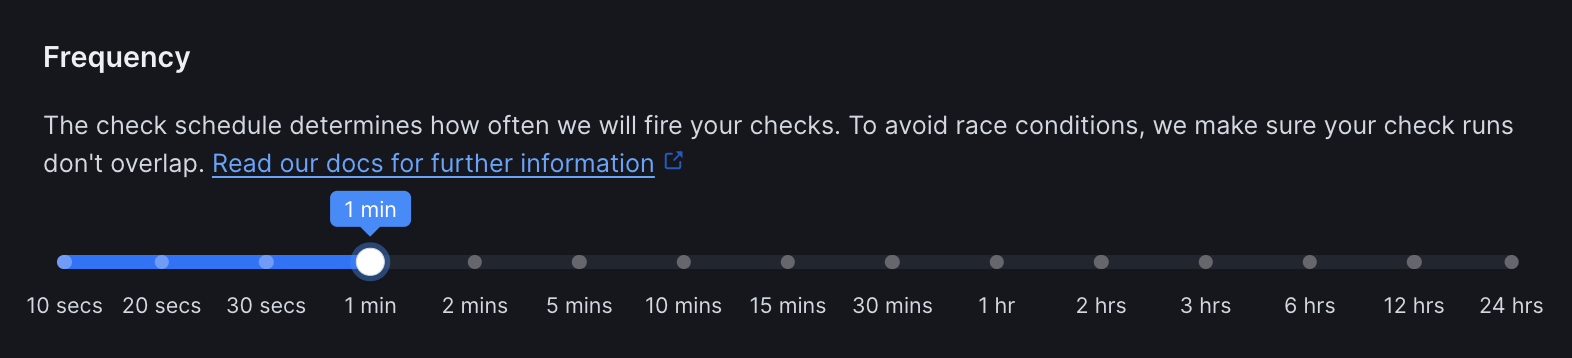
Set how often the monitor runs (every 10 seconds to 24 hours):
* **Response data:** Expected text pattern in the response
* **Response time limits:** Define performance thresholds for degraded or failed states
### Frequency
Set how often the monitor runs (every 10 seconds to 24 hours):
 ### Scheduling & Locations
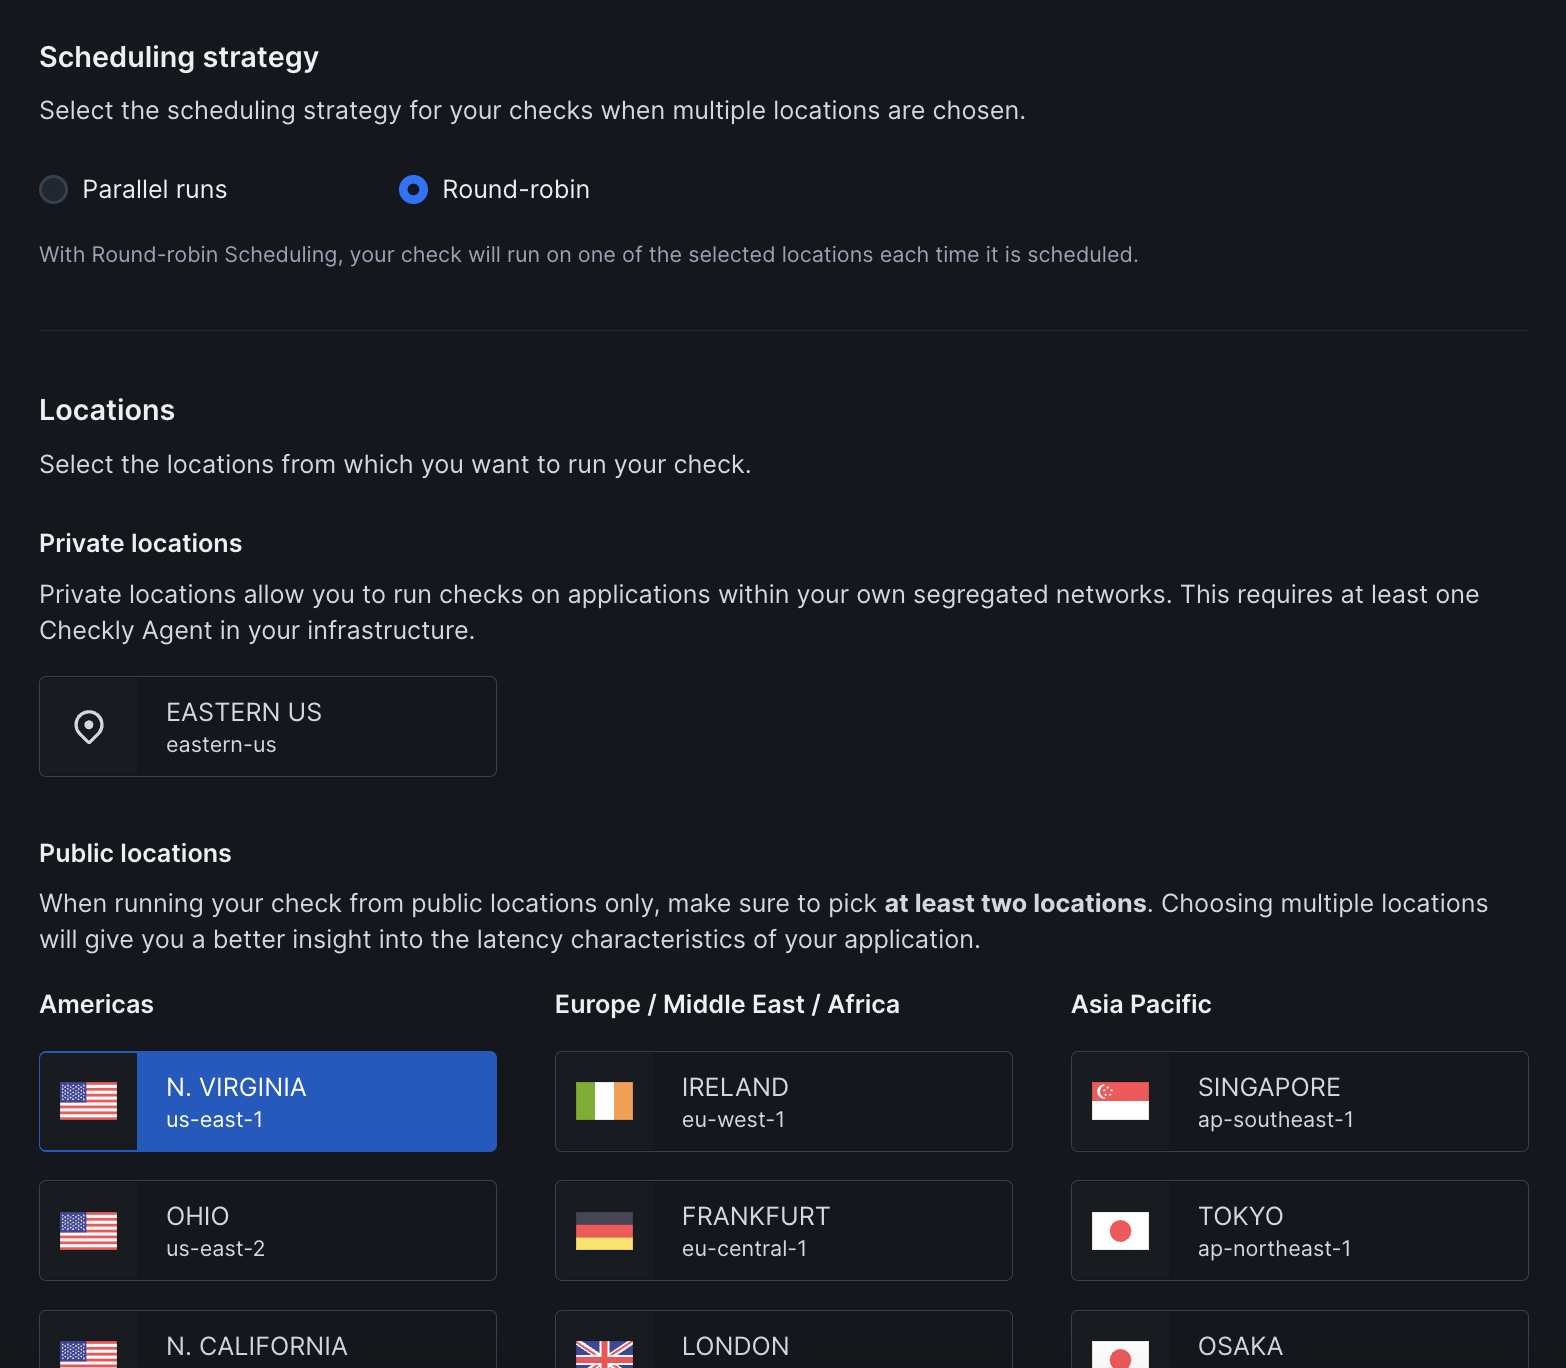 * **Strategy:** Choose between round-robin or parallel execution. Learn more about [scheduling strategies](/monitoring/global-locations#scheduling-strategies)
* **Locations:** Select one or more [public](/monitoring/global-locations/) or [private](/platform/private-locations/overview) locations to run the monitor from
### Additional Settings
* **Name:** Give your monitor a clear name to identify it in dashboards and alerts
* **Tags:** Use tags to organize monitors across dashboards and [maintenance windows](/communicate/maintenance-windows/overview)
* **Retries:** Define how failed runs should be retried. See [retry strategies](/communicate/alerts/retries)
* **Alerting:** Configure your [alert settings](/communicate/alerts/configuration), [alert channels](/communicate/alerts/channels), or set up [webhooks](/integrations/alerts/webhooks) for custom integrations
TCP monitors provide network-level connectivity verification. For application-level monitoring, consider adding [synthetic monitoring](/detect/synthetic-monitoring/overview) to your monitoring strategy.
* **Strategy:** Choose between round-robin or parallel execution. Learn more about [scheduling strategies](/monitoring/global-locations#scheduling-strategies)
* **Locations:** Select one or more [public](/monitoring/global-locations/) or [private](/platform/private-locations/overview) locations to run the monitor from
### Additional Settings
* **Name:** Give your monitor a clear name to identify it in dashboards and alerts
* **Tags:** Use tags to organize monitors across dashboards and [maintenance windows](/communicate/maintenance-windows/overview)
* **Retries:** Define how failed runs should be retried. See [retry strategies](/communicate/alerts/retries)
* **Alerting:** Configure your [alert settings](/communicate/alerts/configuration), [alert channels](/communicate/alerts/channels), or set up [webhooks](/integrations/alerts/webhooks) for custom integrations
TCP monitors provide network-level connectivity verification. For application-level monitoring, consider adding [synthetic monitoring](/detect/synthetic-monitoring/overview) to your monitoring strategy.